Honeypot using Cowrie and ELK stack
After acquiring a vm from azure’s student plan, I wanted to put it to good use, so I decide to build a small honeypot using Cowrie and ELK to sharpen my SOC and analysis skills. and also to troll.
What’s a Honeypot?
A honeypot is a decoy system designed to look like a real target. It doesn’t serve any real purpose , it exists purely to attract attackers, log everything they do, and help you understand how they operate.
I used Cowrie, an SSH honeypot that pretends to be a vulnerable Linux server. When an attacker connects, Cowrie lets them “log in” with almost any credentials, records every command they type, and logs every file they try to download while they think they’re on a real machine. very funny.
The Stack
Here’s everything running on a single Azure VPS (Ubuntu 24.04, Standard D2s v3 — 2 vCPUs, 8GB RAM):
Internet → Cowrie (SSH honeypot, port 2222)
         → Filebeat (ships JSON logs)
         → Logstash (parses, enriches with GeoIP + DNS)
         → Elasticsearch (stores everything)
         → Kibana (visualizes it)
         → Nginx (reverse proxy to Kibana)
         → Discord (real-time alerts via webhook) (i'm not a discord mod trust)
Even tho it’s all on one machine and not production-grade, but its perfect for my use case.
Setting Up Cowrie
Cowrie runs as a Python application. I installed it under a dedicated user (cowrie) in ~/cowrie. The key config change is enabling JSON output so the ELK stack can consume it:
[output_json]
enabled = true
Cowrie logs everything to ~/cowrie/var/log/cowrie/cowrie.json. A single connection generates multiple events ; connect, login attempt, commands, disconnect ; each as a JSON line.
Installing the ELK Stack
Elastic 8.x is on apt. one thing to note: unlike older versions, Elasticsearch 8 uses HTTPS and requires authentication by default. that might cause you trouble i’m just saying.
wget -qO - https://artifacts.elastic.co/GPG-KEY-elasticsearch | \
  sudo gpg --yes --dearmor -o /usr/share/keyrings/elasticsearch-keyring.gpg

echo "deb [signed-by=/usr/share/keyrings/elasticsearch-keyring.gpg] \
  https://artifacts.elastic.co/packages/8.x/apt stable main" | \
  sudo tee /etc/apt/sources.list.d/elastic-8.x.list

sudo apt-get update
sudo apt-get install -y elasticsearch logstash kibana filebeat nginx apache2-utils
after installing, elasticsearch auto-generates a password for the elastic user. get it with:
sudo /usr/share/elasticsearch/bin/elasticsearch-reset-password -u elastic
save it to be able to login later.
Single-node config
Edit /etc/elasticsearch/elasticsearch.yml:
discovery.type: single-node
Connecting Kibana
kibana 8 has an enrollment flow. generate a token, enroll, get a verification code, simple as dat:
sudo /usr/share/elasticsearch/bin/elasticsearch-create-enrollment-token -s kibana
sudo systemctl start kibana
sudo /usr/share/kibana/bin/kibana-setup --enrollment-token YOUR_TOKEN
Then access the setup page in your browser. One thing that caused me agony to figure out: if you go through the interactive browser enrollment, stale session cookies will cause an “unauthenticated” loop on login even with correct credentials. Always use a fresh incognito window. and if that doesn’t help, i figured out the solution is adding this header to the nginx reverse proxy and it solved it. it strips nginx auth from kibana
proxy_set_header Authorization "";
Nginx reverse proxy
Kibana listens on localhost:5601. I put Nginx in front on port 8080 with basic auth as an extra layer:
sudo htpasswd -c /etc/nginx/htpasswd.users admin_kibana
server {
    listen 8080;

    auth_basic "Restricted Access";
    auth_basic_user_file /etc/nginx/htpasswd.users;

    location / {
        proxy_pass http://localhost:5601;
        proxy_http_version 1.1;
        proxy_set_header Upgrade $http_upgrade;
        proxy_set_header Connection 'upgrade';
        proxy_set_header Host $host;
        proxy_set_header X-Real-IP $remote_addr;
        proxy_set_header X-Forwarded-For $proxy_add_x_forwarded_for;
        proxy_set_header X-Forwarded-Proto $scheme;
        proxy_set_header Authorization "";   # this is what i mentioned earlier
    }
}
This took me a while to figure out because of the auth issue, because nginx forwards its own auth header to kibana which tries to use admin_kibana as elasticsearch user, but alhamdulilah i solved it.
Logstash Pipeline
Cowrie ships a Logstash config in its docs/elk/ folder. I copied it and extended it with human-readable summaries.
The pipeline does four things:
- Receives logs from Filebeat on port 5044
- Parses the JSON into structured fields under
honeypot.* - Enriches with GeoIP (MaxMind GeoLite2-City) and reverse DNS
- Adds summary fields I defined
The GeoIP enrichment is particularly useful, every attacking IP gets a country, city, region, and coordinates attached, which feeds the map visualization in kibana, maybe i did that to look like a cool hackerman but who cares :)
one important change for Elastic 8.x , the Elasticsearch output needs credentials and HTTPS:
output.elasticsearch {
    hosts => ["https://localhost:9200"]
    user => "elastic"
    password => "urpassword"
    ssl_enabled => true
    ssl_verification_mode => "none"
}
Filebeat
Filebeat watches the Cowrie JSON log file and ships events to Logstash. The key parts of filebeat.yml:
filebeat.inputs:
- type: log
  enabled: true
  paths:
    - /home/cowrie/cowrie/var/log/cowrie/cowrie.json*

output.logstash:
  hosts: ["localhost:5044"]
make sure output.elasticsearch is disabled you want logs going to Logstash for enrichment, not directly to Elasticsearch, otherwise it’ll just be a EK stack lol.
Real-Time Discord Alerts
I added a Discord webhook to Logstash so I get notified in real time whenever someone connects, attempts a login, or runs a command. The webhook fires as a rich embed with the event type, source IP and timestamp.
This required the logstash-output-http plugin, which fortunately ships bundled with Logstash 8.x, so no installation needed.
What I found
now onto the juicy part! within the first few hours, the honeypot was already logging connections. Here’s a real event from the first day:
{
  "honeypot.eventid": "cowrie.session.closed",
  "honeypot.src_ip": "220.197.14.60",
  "source.geo.country_name": "China",
  "source.geo.city_name": "Guiyang",
  "source.geo.region_name": "Guizhou",
  "honeypot.duration_ms": 120089,
  "summary": "Session closed after 120089ms from 220.197.14.60"
}
an IP from Guiyang, Guizhou province, China connected and held the session open for exactly 2 minutes (hitting the timeout) this is classic automated scanner behaviour: connect, try some credentials, wait for a response, move on.
CHANGEMENT
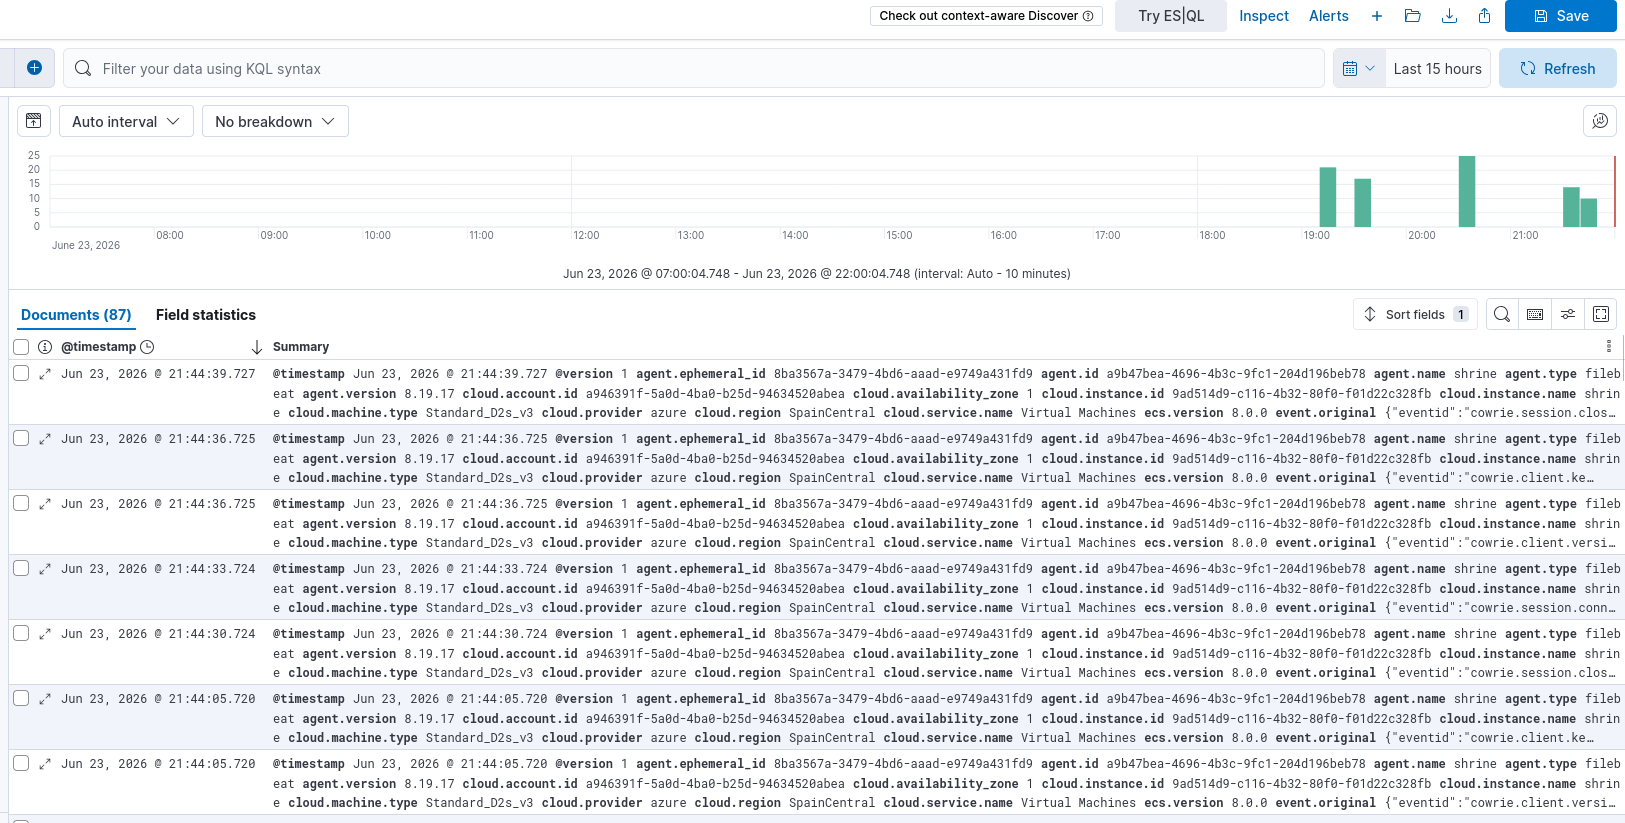
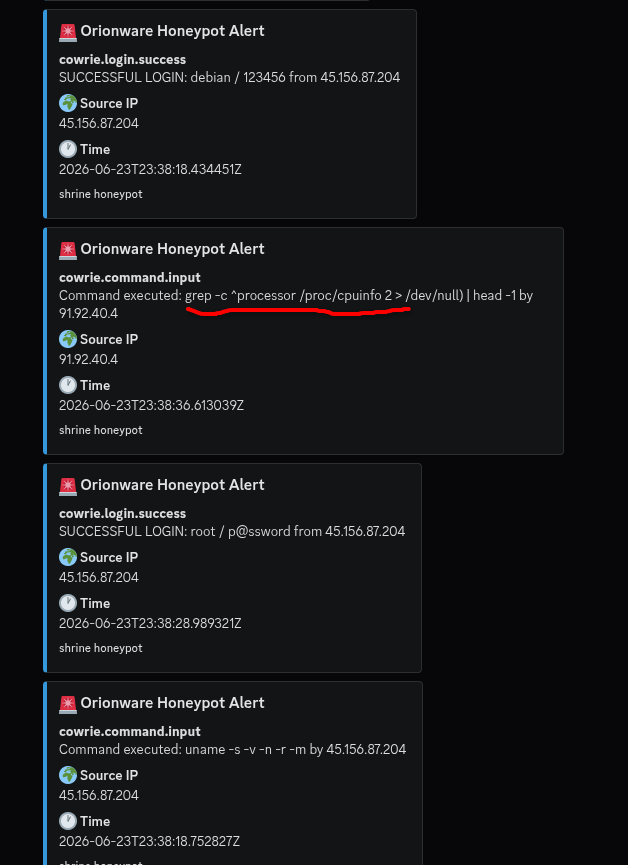
I changed cowrie’s port to 22 (default ssh port), and that’s when the real traffic started coming in, lots of automated bots that ran scans, connected, then deconnected such as this one:
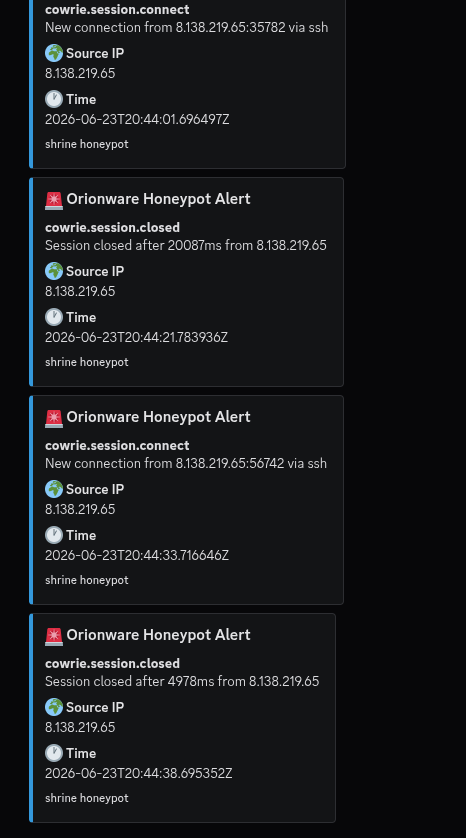
Aaand another: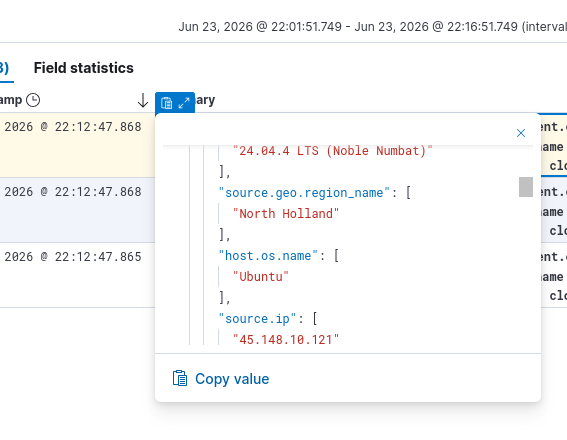
We could see this one actually used default credentials to log in:
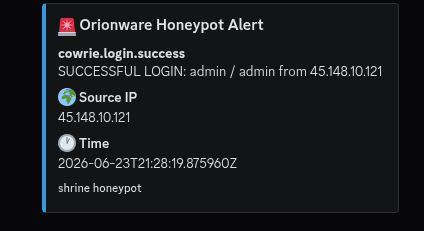
What caught my attention is that attacker’s run commands blazingly fast, to explore the file system, one even tried to check the processsor it has, and another checked for nvidia graphics (maybe for crypto mining)
Additional Info
I actually intended to use Wazuh as a SIEM to monitor the honeypot, but I encountered a LOT of issues trying to link it with cowrie’s logs, and ended up drowning in a sea of config files, hell naw. i ain’t doing all that.
BUT!
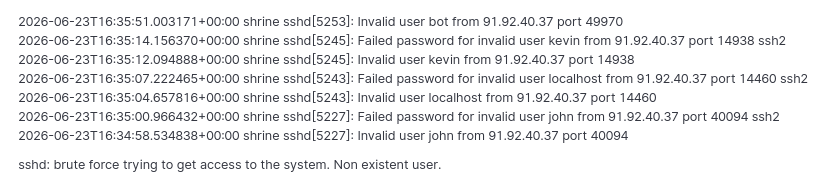
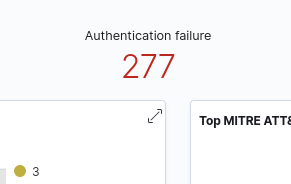
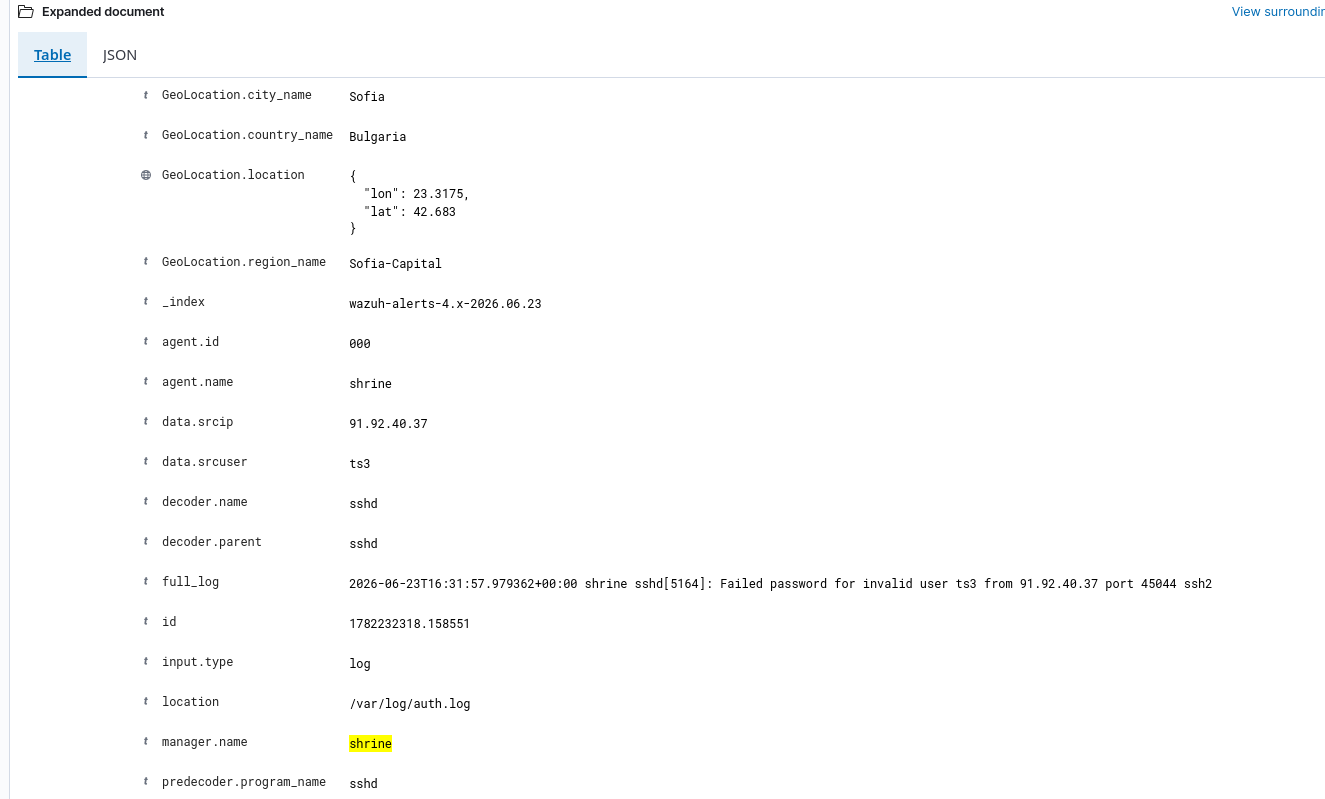
Wazus was running on my VPS and monitoring it (not the cowrie system cuz i didn’t figure that out), and it did catch some bruteforce attempts, here are some pictures:
That’s interesting ain’t it!
What I learned
- Configuring a VPS: configuring my vps for a specific purpose by managing network ports, different rules .. etc
- Logging, Alerting, SIEM workflow: this small experiment taught me how to monitor, log, use SIEMs (especially Wazuh which is an actual entreprise level SIEM)
- Reverse Proxy Setup
- Attackers are everywhere: i didn’t advertise this server anywhere. it showed up in automated scans within minutes of being reachable.
References
if you want to set this up yourself, the Cowrie docs are at cowrie.readthedocs.io and the ELK-specific setup is at docs.cowrie.org/en/latest/elk/README.html.